a 6-minute read
Market basket analysis is a data mining technique used to uncover meaningful patterns of products frequently purchased together in a store’s transactions history.
In other words:
The market basket analysis technique helps find items that people buy together. This is a way to figure out which items are related, or which items customers buy the most. This type of data analysis is based on Association Rule Mining, a subset of machine learning which learns “rules” that account for items purchased together.
Association rule learning is a method for discovering interesting relations between variables in large databases. It is intended to identify strong rules discovered in databases using some measures of interestingness.
[Piatetsky-Shapiro, Gregory (1991), Discovery, analysis, and presentation of strong rules
Diapers and Beer: A Statistical Love Story
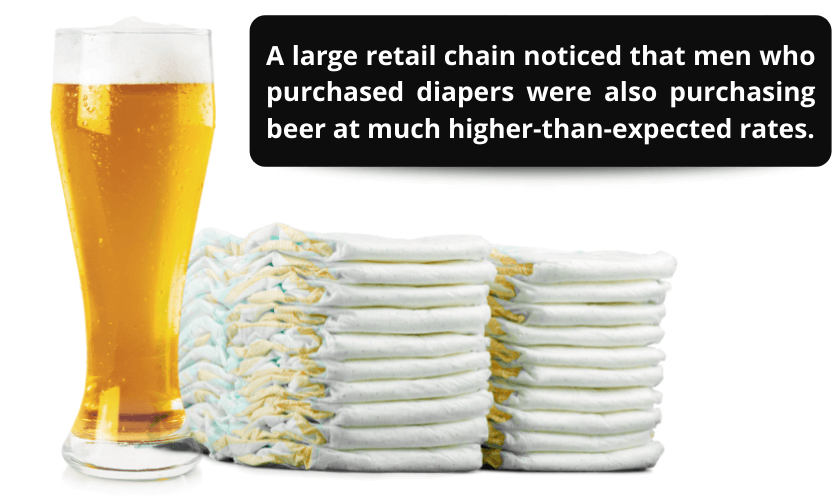
An often-used example of market basket analysis is that of diapers and beer.
As the story goes, a large retail chain noticed that men who purchased diapers were also purchasing beer at much higher-than-expected rates.
The best explanation for this finding was that when fathers were tasked with the errand of buying diapers, they were also rewarding themselves with a purchase of their favorite brand of beer.
To capitalize on this consumer behavior finding, the retail chain moved one product closer to another in the same aisle and their transaction boosted.
This story may actually be a clever urban legend, but it is also a powerful example of leveraging one’s data to find hidden revenue-boosting opportunities.
An actual real-life example involved a beauty products store. This store used market basket analysis to uncover a strong relationship between a particular brand of shampoo and the same brand’s conditioner.
This store’s revenue-maximizing solution, however, was to never offer the two products bundled together. They found that if they discounted only the shampoo, customers would buy both items at higher rates while still paying full price for the conditioner.
Explore INSIGHTS for FREE
Explore the ultimate source of business intelligence insights for eCommerce. Incredible results are just a few clicks away.
This data mining technique has been around for decades but is arguably even more applicable in today’s digital eCommerce world.
By connecting a store’s eCommerce platform to a secured data warehouse and powerful analytics software, Conversion Advocate’s business intelligence tool Insights can run a market basket analysis report for virtually any eCommerce client.
Real World Example
So how can we take advantage of these findings in the eCommerce world?
The first step is to run a basket analysis and understand what your store’s strongest product purchase patterns are.
After exploring these insights, one way to then leverage this information is to simply offer these products as bundling options on product pages.
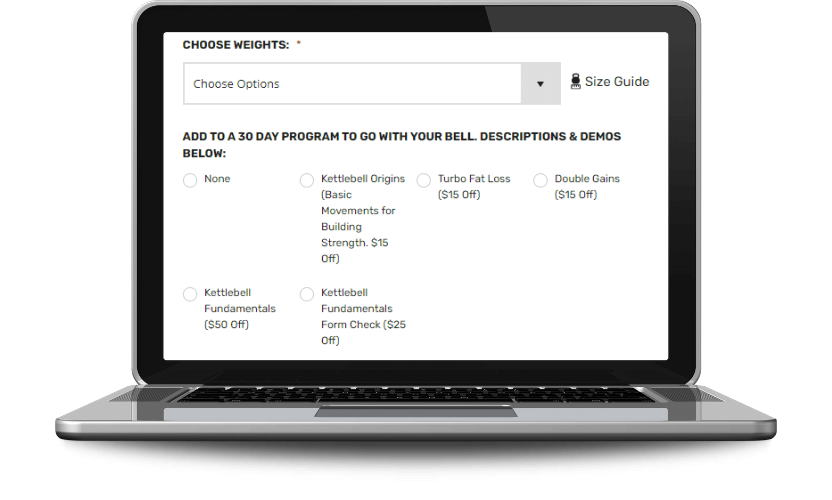
ConversionAdvocates ran an experiment like this recently with a popular fitness website.
Strong relationships were found to exist between purchasers of fitness training programs and specific fitness products.
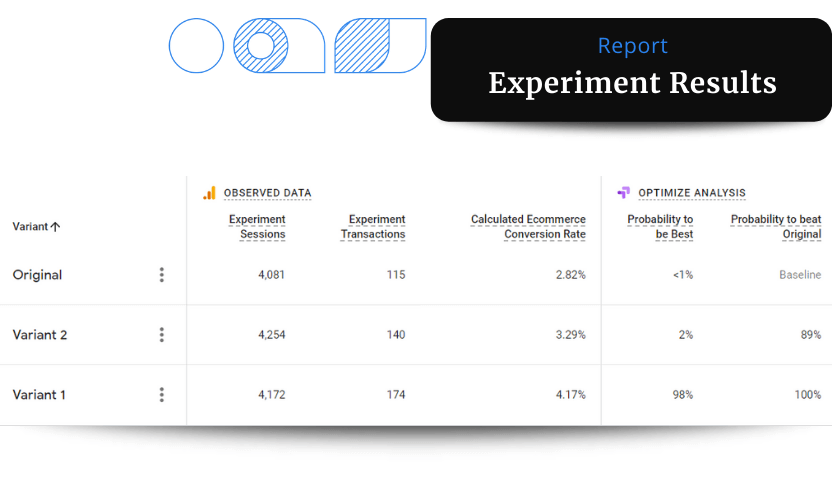
The hypothesis tested was that offering training programs with a discount directly on fitness product pages would increase overall conversion rates for the website:
The experiment found that the variant with the additional product offers improved transaction conversion rates by 48% during the experiment, with 100% confidence to continue converting higher than the original version of the product page.
Not only did conversion rates improve but revenue per user and average order values increased as well.
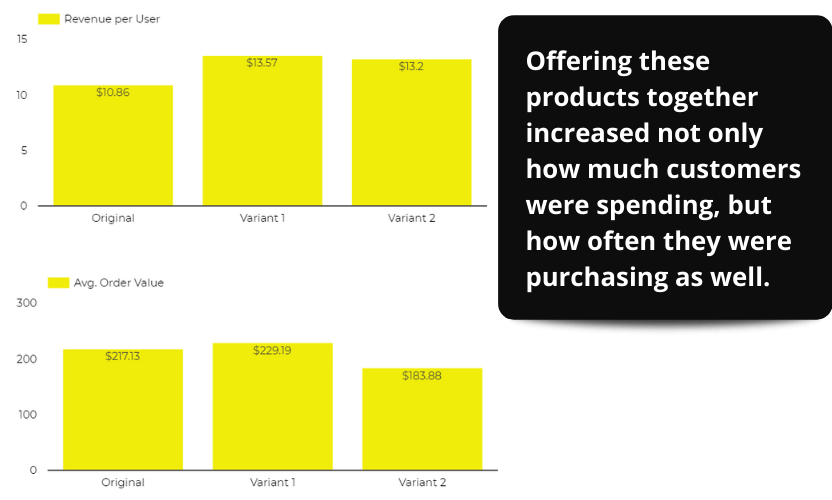
Exploiting existing purchasing patterns by making it easier for customers to add popular products together improved this website’s performance in both transaction conversion rates and revenue.
Tutorial on How to Use Market Basket Analysis in Insights
Within the business intelligence platform Insights, custom reports can be created by the ConversionAdvocates analytics team and pushed directly into the “BI Tunnel” section of Insights.
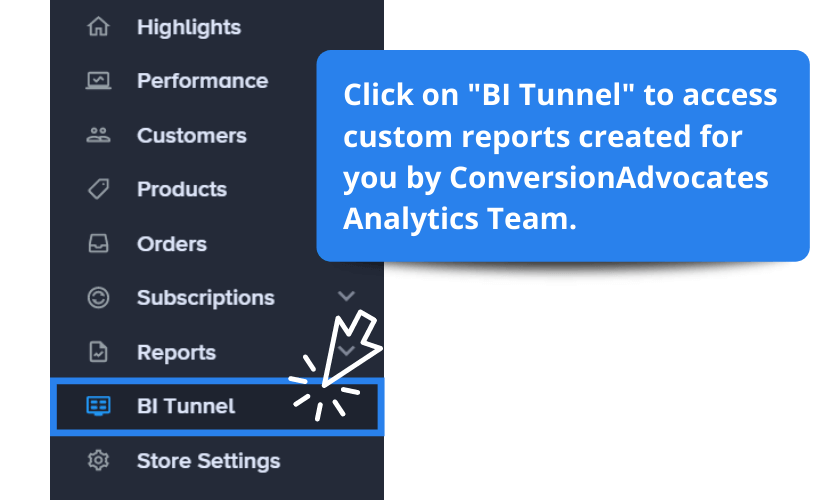
This section of Insights is where all of the custom reports are stored. One may also find reports on page:
- Conversion Rate Comparisons,
- Forecasting Page Visitors, and
- Conversion Rates by Locations and Devices.
From here, one can simply click on the “Basket Analysis” report and the most recently run report will be shown.
Within this report one will also find three tables ranking product combinations by the key metrics of support, confidence, and lift.
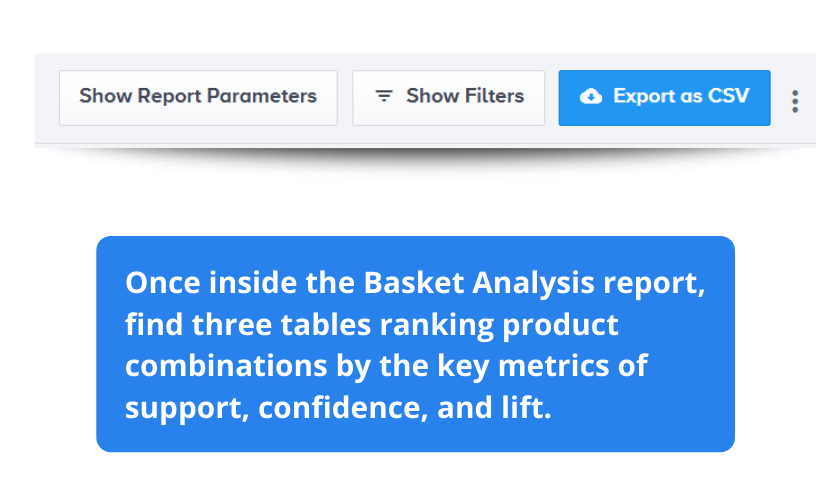
To change the date of transaction history, just click on “Show Report Parameters” and enter a new date into the drop-down menu.
Interpreting Basket Analysis Findings: Deeper Dive
It is not enough to simply notice a product combination occurring and then suddenly declare it as a meaningful trend in our customers’ purchasing behavior.
One must always be aware of spurious correlations – which exist in every dataset. These are the correlations that occurred simply by chance.
To avoid making this mistake, we also need a proper framework for statistically assessing our market basket analysis findings.
Thankfully, the three metrics of the Apriori algorithm:
- Minimum support,
- Minimum confidence, and
- Lift ratio
give us a full picture of how often these purchase combinations occur in transactions and how strong their statistical relationship is.
- Support tells us how often a purchase with this combination took place.
- Confidence gives us the probability that the “consequents” will follow the “antecedents”.
- Lift tells us how statistically significant this finding is. The higher the lift, the less likely it is that this purchase combination occurred by chance.
How did Kettlebell Kings increase sales conversion rates by 151% and monthly recurring revenue by 35% in a single experiment?
Apriori Algorithm Keymetric 1 | Support
Support is simply the percentage of transactions in which a particular product combination occurred.
If, for example, your antecedent is beer and your consequent is diapers, then support is calculated as the number of transactions containing both diapers and beer, divided by the number of total transactions.
SUPPORT = Transactions with Diapers and Beer / Total Transactions
This information can help with data-driven decision making:
- Does this pattern occur frequently enough for it to be worth our time to take action?
- What is the potential improvement in sales based on how often this purchase pattern occurs?
- Moreover, if support is very low, this pattern may simply have occurred by chance.
Apriori Algorithm Keymetric 2 | Confidence
Confidence is also a percentage, telling us how often the product, or products, in our consequents (beer) occur in transactions containing our antecedents (diapers).
Confidence provides an estimate to the question: If we know a customer is buying diapers, what is the probability that they are also buying beer?
CONFIDENCE = Transactions with Diapers and Beer / Transactions with Diapers
This metric helps us understand how strong the relationship between the two products is.
The higher the confidence, the higher the probability that a customer buying diapers is also purchasing beer.
Apriori Algorithm Keymetric 3 | Lift
To understand lift, we first need to understand the concept of independent and dependent variables.
In statistics, events A and B are said to be independent if the probability of them occurring together is equal to the probability of event A multiplied by the probability of event B.
If two events are independent, then the fact that event A occurs will have no impact on the probability of event B occurring.
This is because no meaningful pattern exists between the two variables.
If diapers and beer are independent, then knowing that a customer is buying diapers will have no impact on the probability of them buying beer.
With dependent variables, on the other hand, knowing information about one does impact the probability of the other.
Probability of A & B = Probability of A * Probability of B
The ratio of lift takes advantage of this formula of independence. Lift is simply the support of A & B (percentage of transactions containing A & B) divided by the support of A times the support of B.
LIFT = Support of A & B / Support of A * Support of B
If these are independent variables, then the lift will be exactly 1.
If, on the other hand, they are positively correlated, then the numerator will be greater than the denominator, and the lift will be greater than 1.
Therefore, the greater the lift, the more positively correlated our variables are and the relationship is a meaningful one.
If the lift is less than 1, then these are negatively correlated variables.
Lift provides us with a deeper understanding of how strong the statistical relationship is and whether the relationship between the variables is positively or negatively correlated. While confidence also provides insight into the strength of the relationship, lift gives us a fuller picture of its magnitude, as the value can range from zero to infinity.
Some Final Thoughts
Learning from the past is one of the best ways to make smart decisions for your future. And thankfully, it seems like every day we’re capturing more and more data!
Just look at how many online stores have databases that contain a goldmine of potential insights into customer behaviors.
With powerful lessons just waiting to be learned – there’s no better time than now (or ever) for business intelligence software such as Insights to do all that heavy lifting so you don’t need to worry about any information overloads or anything else life throws your way!
Just imagine – you can become an expert data-mining guru with just a few clicks of your mouse.
In a matter of minutes, powerful data mining techniques such as market basket analysis will be applied to your online business and in return – you’ll have the opportunity to make data-driven decisions that will lead to more conversions!
So stop wasting your time and money on speculating! Uncover revenue-boosting opportunities hidden in your data right away.