a 11-minute read
To follow along and get the most out of this tutorial, download a free trial of INSIGHTS BI software before continuing.
The world has been going through some major changes for some time now and data has never been more valuable. With more and more businesses going online every single day, and with new privacy policies popping out from every corner, the need for insight into data is greater than ever before.
But here comes the tricky part:
- How do you make sense of all the data you’re capturing?
- How do you manage all those different platforms where your data is stored?
- How do you transform those numbers into actionable intelligence?
- Can you even do all this without an in-house data scientist?
Well, this is where BI solution kicks in.
Business intelligence software is a type of application software that helps you cut through the noise with clear, actionable data. The BI software can help you make sense of your data and transform it from a pile of numbers on a screen to actionable decisions that will improve your business performance.
The best part?
You don’t have to be a data scientist, and you don’t need to take tons of courses to learn how to use the full potential of the Insights BI platform.
So, are you ready to say goodbye to endless reports and unstructured data? Then let’s dive into this business intelligence tool tutorial!
What are “Insights”?
Insights is a business intelligence platform that will easily become your best business-friend.
Here’s why: you can connect and transform 90+ different data sources in just a few clicks.
This means you can say farewell to getting lost in numerous data warehouses, memorizing how they work, and missing out on optimization opportunities because you forgot about the existence of some of those platforms.
Once integrated with your eCommerce platform, Google Analytics, email marketing platforms and advertising channels, Insights BI tool will help you find new areas of opportunity to maximize conversion rates, profitability and lifetime value for your business.
To make things even clearer – all of your data will be visualized. You see, data visualization plays a crucial role in the entire business intelligence dynamic. This means that all of your text-based data will be transformed into charts, graphs, tables that will help you instantly understand it.
After all – the most powerful of all human sensory abilities is vision, which is why visualized data equals better decisions.

So now that you learned what bi software does in general, let’s learn how to use it.
Highlights Section
When you first log into Insights, you’ll see the highlights section of the platform. This area contains the most important high-level data about your business, such as:
- Revenue,
- Gross profit,
- Orders.
- Sold products,
- Average order value over time,
- Refunded amount over time,
- Visits,
- Conversion Rates.
All of these charts are affected by the date range selector, and you can also change them into another graph if you wish, such as a bar chart.
Another important area about these charts is that you can group them by day of the week or time of day if you want as well.
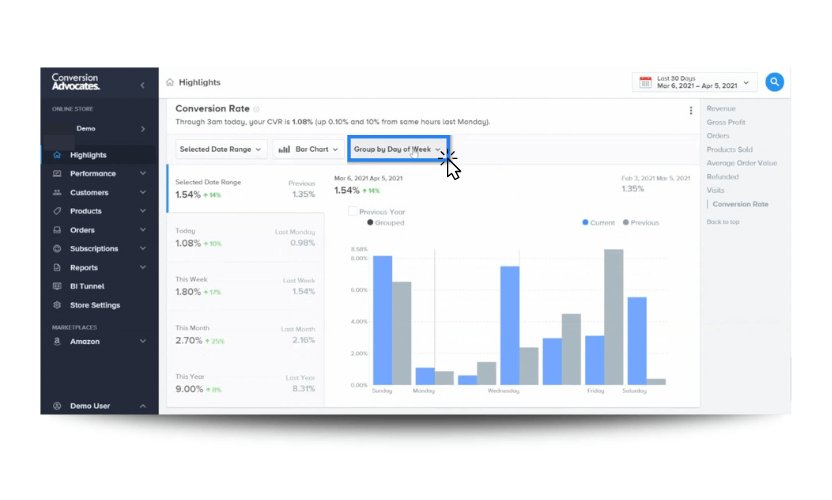
For example, if you wanted to know on what day of the week your conversion rates are highest, just change the view to “day of the week”. In this case, over time highest conversion rates, seen in blue, happened on Sundays and Wednesdays and much less on Mondays and Tuesdays.
But why would this be important for you?
Well, this could be really valuable information if, for example, you’re launching a new email marketing campaign and you want to maximize conversions for all of this new traffic you’re getting from your email marketing, Sunday might be the best day to launch, where people have tended to convert at the highest rates, as opposed to Monday or Tuesday when results might not be as good.
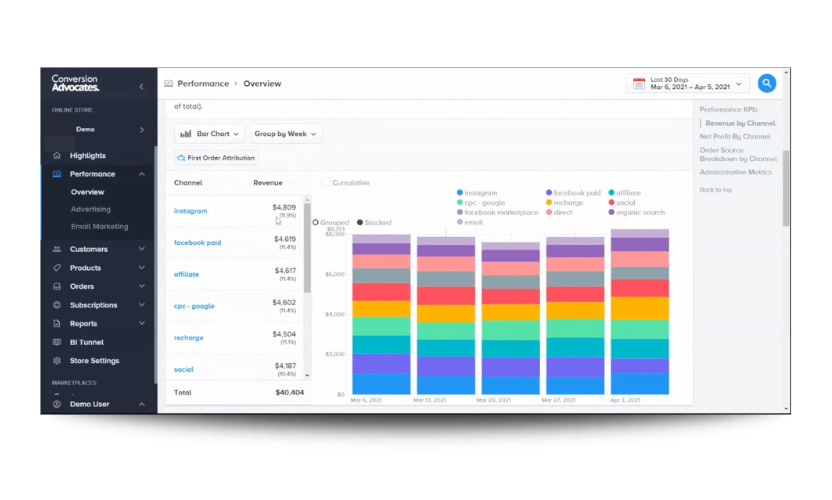
Performance Section
The next section of Insights is dedicated to the performance. This section of our bi software combines data from both all advertising sources and your eCommerce platform to calculate profitability metrics for your business.
Let’s take a look at a real-life example.
You can see in this example the gross margin has been around 22.8%.

The report below will show you the breakdown in terms of revenue for each channel. In this case, Instagram has led to the most revenue overall, but this business intelligence report offers so much more than just an overall look.
If you scroll down, the report Net Profit By Channel will also tell you how each channel has been performing in terms of profitability.
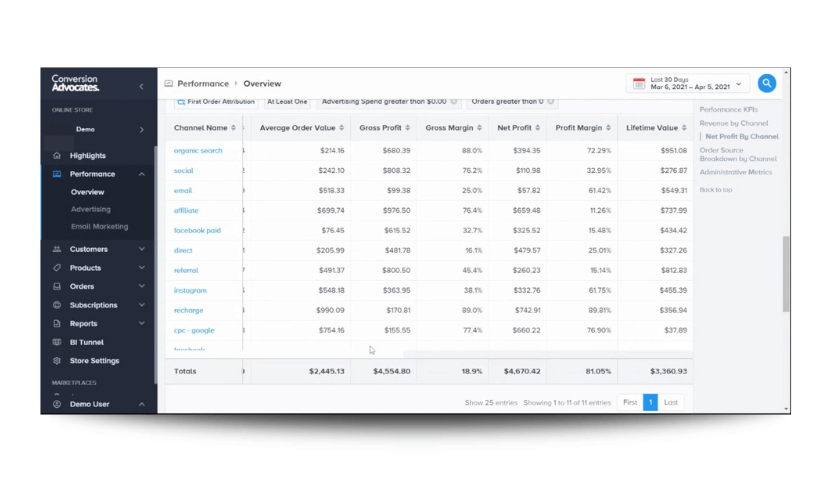
This analytic is done by calculating the advertising costs as well as the costs coming from the eCommerce platform. So we can see which channel has been the most profitable, as opposed to what’s just led to the most orders and revenue.
To top it off – this section of Insights includes predictive analytics, so it will also give you the lifetime value metric, projecting what the average customer is expected to spend with you over their lifetime.
So, in our example, you can see that organic search has led to one of the highest lifetime value, where the average customer is anticipated to spend $951 with the business, followed by Facebook paid average customer with $438 lifetime value, whereas Google CPC has only been at $38 in terms of what the customer is expected to spend with them over their life.
These really powerful and actionable insights will help you see if your ads are reaching the right types of customers, the ones that are going to lead to the most repeat business or not.
Performance Section | Advertising and Email Marketing
The performance section includes separate advanced analytics for advertising and email marketing. Using the bi tool you can pull up all the most important data from all of your advertising sources instead of having to log in to each one separately.

In this real-life example, you can see Facebook ads. If this customer had Google ads, they would be in there as well as major email marketing platforms, such as MailChimp. So instead of logging in to multiple reporting platforms and getting lost in all that data – you can see everything in one place with these bi reports.
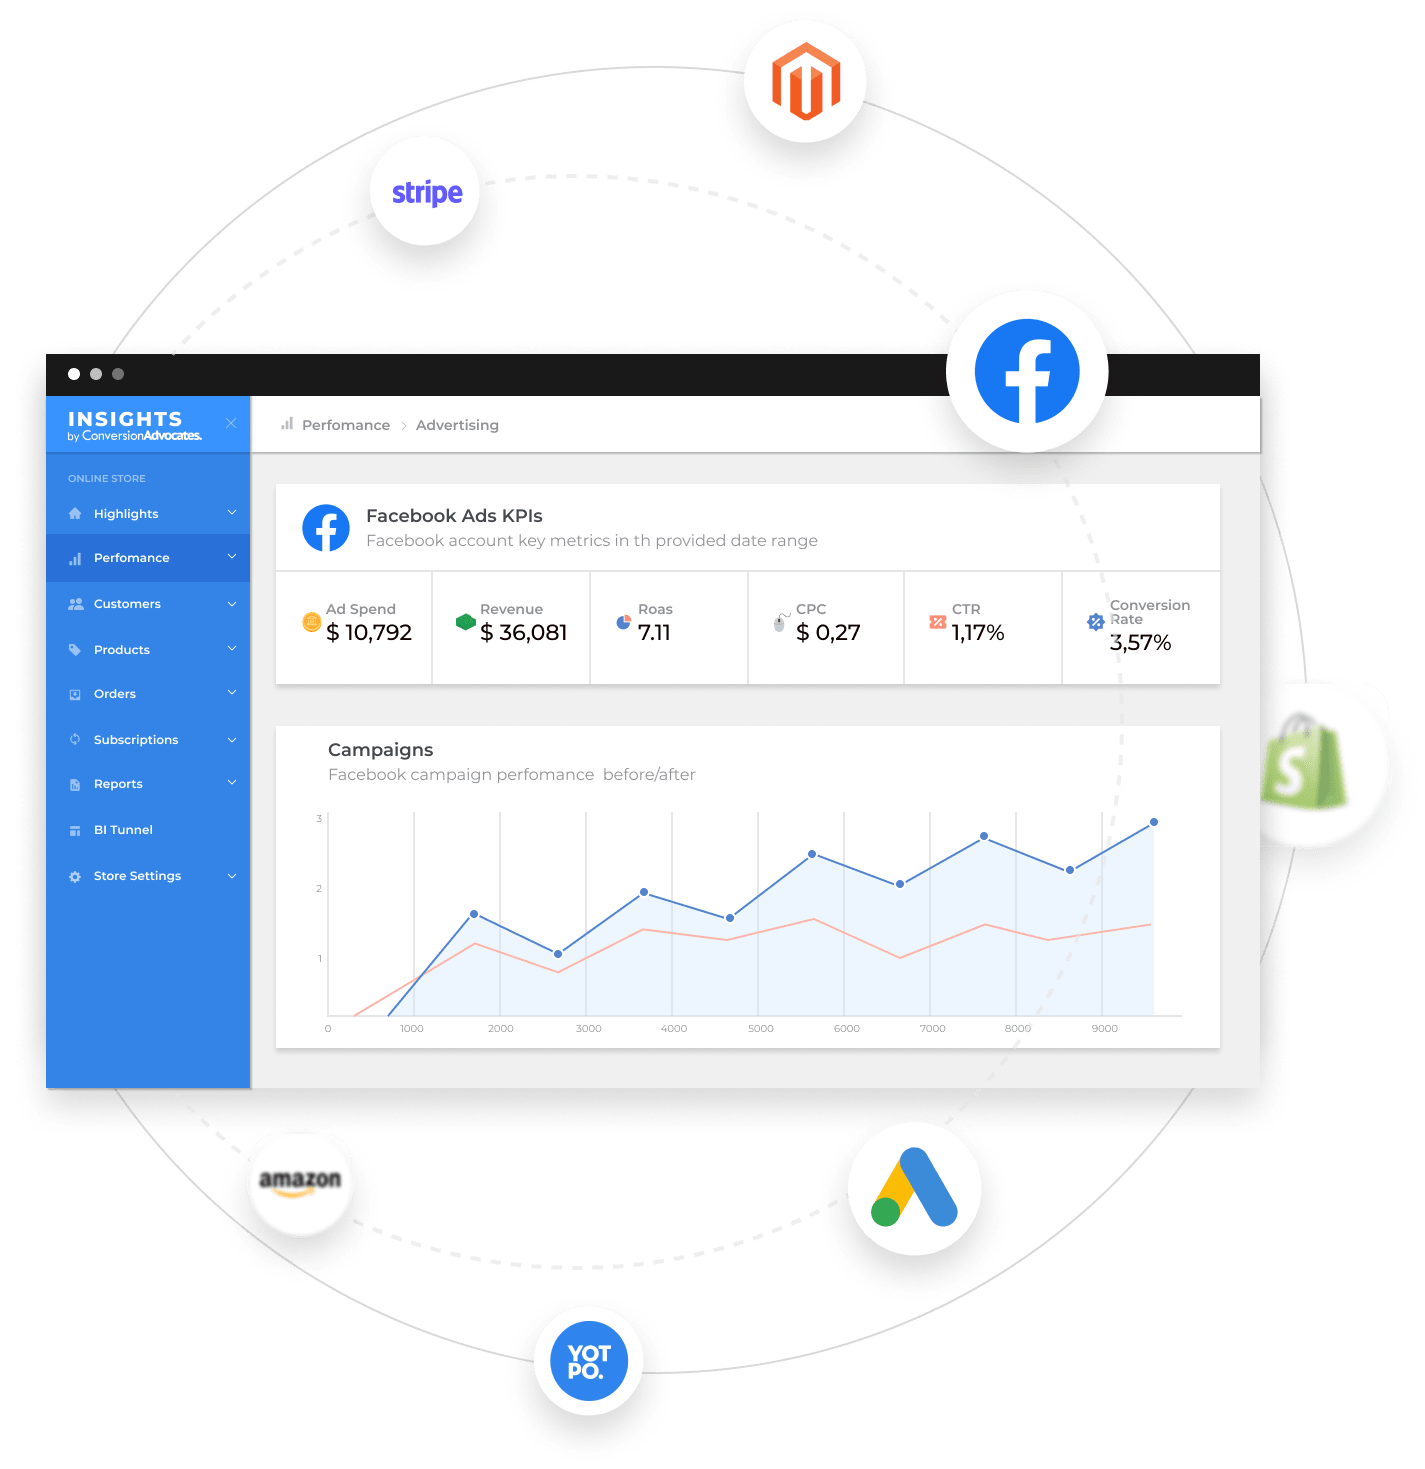
Connect & Manage Data Across 90+ Platforms All In One Place
Build a better customer experience and create built-in retention, acquisition, retention, and demographic data helps you relate to your customers’ needs so you can prevent at-risk customers from churning.
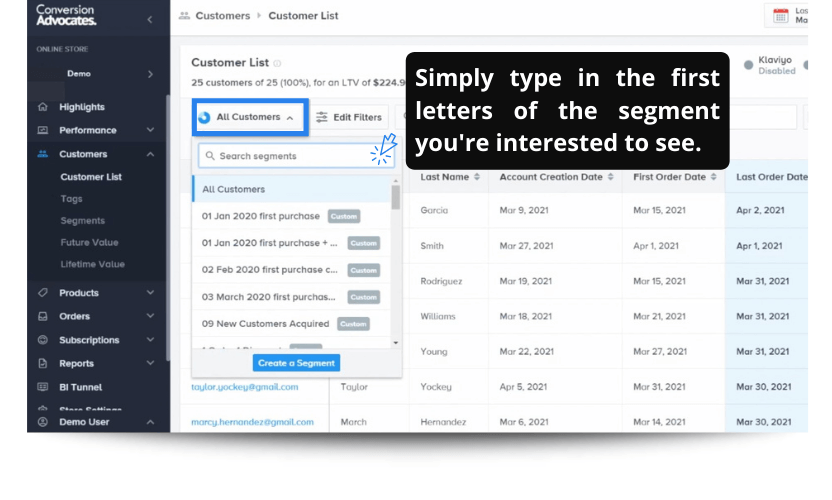
Customer Section
Our modern BI solution offers you the possibility to learn everything you ever wanted about your customers.
If you want to know who your biggest spenders are, you can pull up that list very quickly. This could help you create an exclusive email marketing campaign for the biggest spenders that are more likely to buy at higher rates or higher purchase items.
This type of data analytics will help you segment your customers in a way that will not only help you tailor the content and offer to their needs but also help you get the highest lifetime value out of each of them.
Using the same reporting tool you could also see who are your at-risk customers. These are the customers who you are most likely about to lose. We normally characterize them as those who haven’t ordered after a certain amount of time, but they are not yet lost. These are the types of customers where you might want to offer a discount, get them to go over the edge and purchase from you again.
You can even go ahead and click on a specific customer, and it will tell you everything you want to know about this customer and how to best market to them so you could make the best possible business decision.
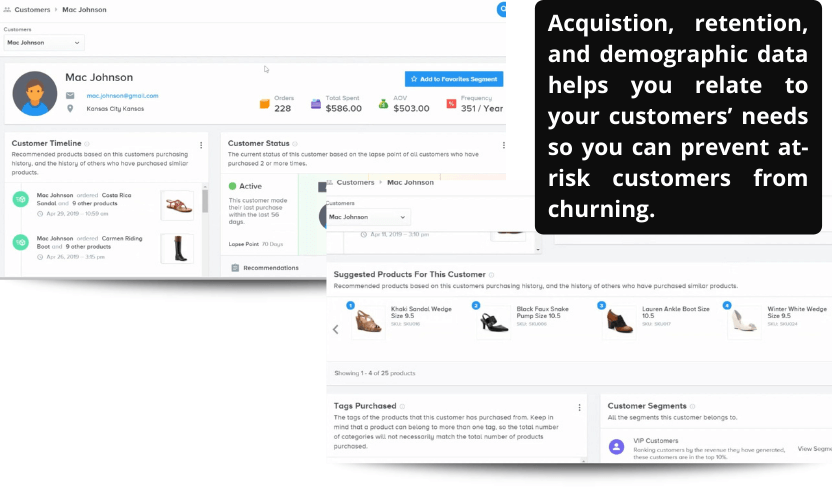
So, for example, you could go with recommended products. These are the insights on top recommended products that this customer will most likely purchase from you next, so you can create a product recommendation email that’s tailored specifically for this customer.
If you scroll down further, you’ll also be able to see what segments Insights put this customer into. There are:
- VIP,
- Big spender,
- Big-ticket spender,
- Repeat customers,
- Abandoned Cart,
- Most Active Customers,
- Paying Customers,
- Three months since the last purchase,
- Active,
- At Risk.
You can then click on any of these segments to see the full list of customers labelled with one of these tags. This will allow you to target them better with content tailored specifically to the needs of these customers.
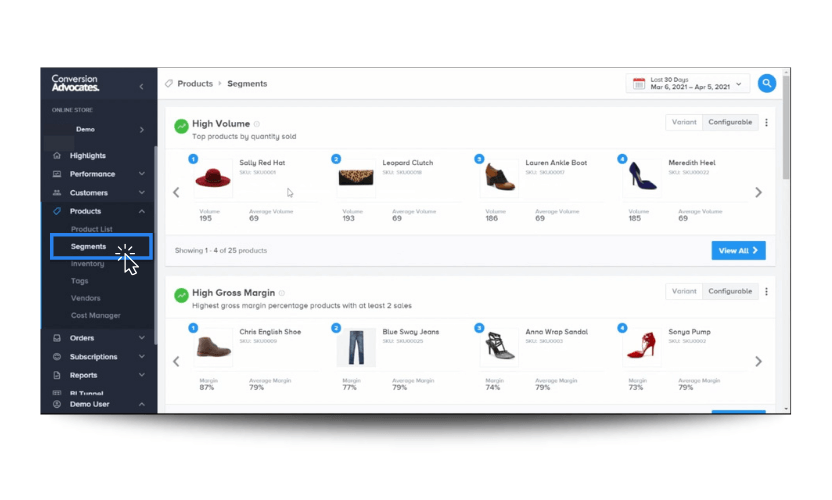
Product Section
This business intelligence solution includes a separate section dedicated solely to in-depth data analysis of products.
You can quickly check what your highest volume products and the highest margin products have been recently, or what are the hottest and coldest products.
If you go to the full product list, you can get even more valuable data points, such as what are your highest lifetime-value products. Although they might not be highest in revenue, they might be highest in the anticipated revenue that customers which purchased these will spend with your business long term.

So in this example, customers that purchased the hat anticipated spending the most with that business over their lifetime. This is a great opportunity to run an experiment! For example, you could test showing more customers the white hat to see if it would lead to an increase in revenue for the business long term.
There are many other areas of valuable information you can find going through all the charts within Insights. But why stop there when our team can create for you custom reports based on advanced data mining techniques going even deeper into any area you’d like?
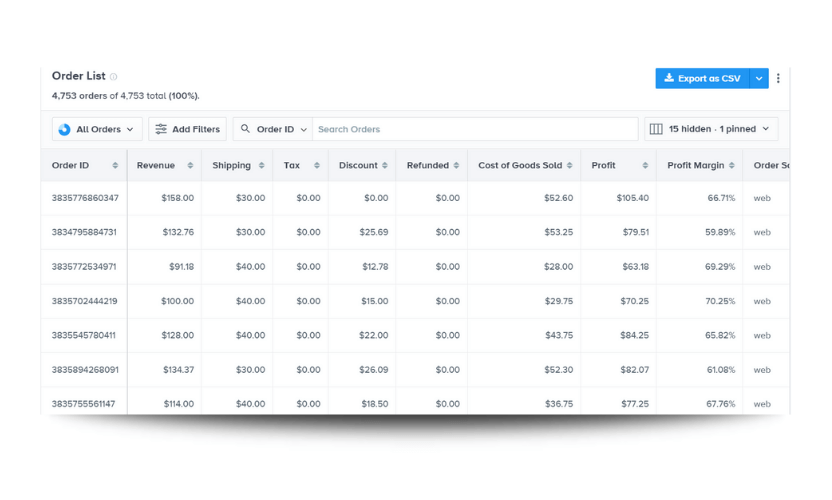
Orders Section
The orders section is broken down into subsections of Order List, Shipping, and Discounts. The first subsection of “Orders” provides very granular details about every order made within the selected time frame, ranked by the most recent orders first.
This section is useful when you need to retrieve very specific information about recent orders. Scrolling through this section, one can quickly see each order’s profit, revenue, profit margin, shipping fees, quantity purchased, source, device, etc. Any of these fields can be used to filter the table as well. One can easily pull up every order made on mobile or from a specific channel, for example.
Then, as with all tables in Insights, exporting this information into a csv file for further analysis in excel is just one click away.
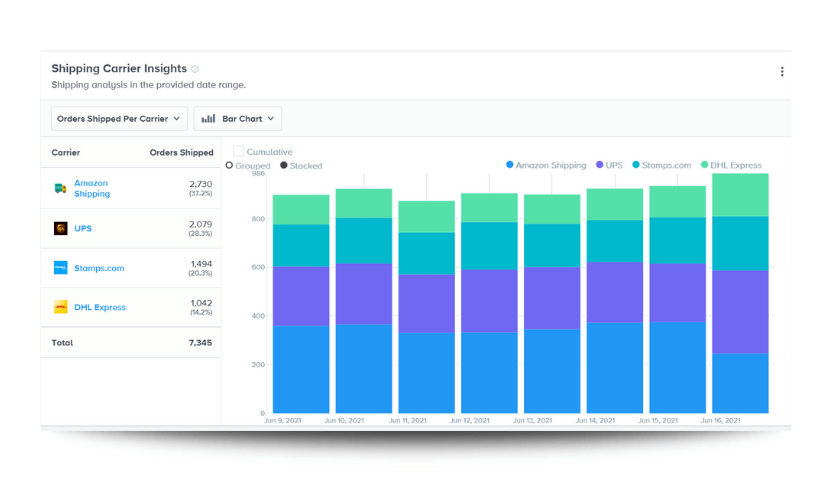
If your business also has a platform to manage shipping, fulfillment, or third-party-logistics, then the Shipping section in Insights has you covered.
From the Shipping section, one can view all of the key performance indicators from your shipping platform in one place. This include insights such as total shipping cost, average cost per order, and shipping margin as well. One can also view insights broken down by shipping carrier and view the shipping data of each individual order as well.
The Discounts section paints the picture of how discounting and using discount codes has impacted your business. It begins with high-level metrics about how often discounts were applied, total revenue from discounts, total amount discounted, and the average amount discounted.
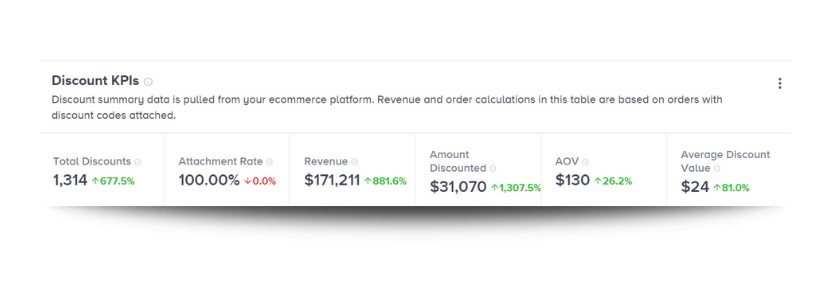
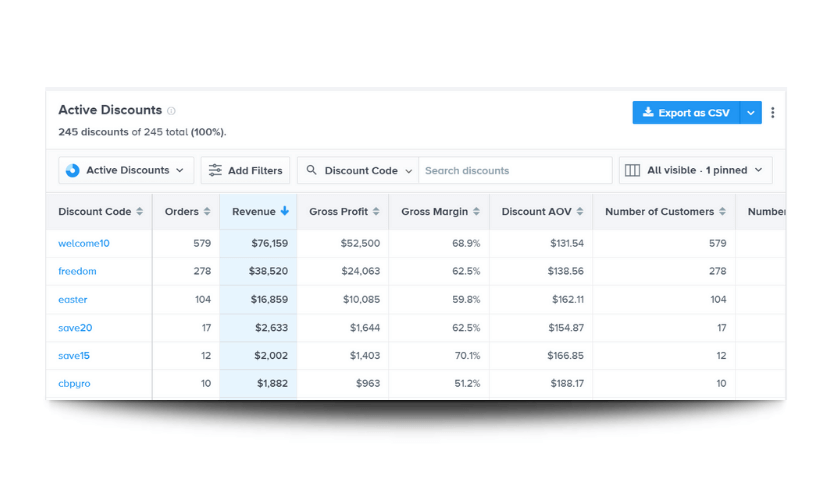
Then further down the page a breakdown is provided showing the impact of each specific discount code itself, including the profit margin of the discount, how much revenue it led to, its gross profit, and the average number of items purchased per discount code. Within this section, one can understand how profitable, or perhaps harmful, discounting has been for their business.
Subscriptions Section
This section was made for subscription based businesses. It is often extremely difficult for a subscription business to truly understand how their various plans and subscription lengths offered (ex. monthly vs. yearly) are actually impacting their profitability and customer retention.
This section will help you leverage your data to:
- Maximize recurring revenue,
- Improve retention,
- Reduce churn, and
- Understand your actual subscription profitability and lifetime value.
Insights currently supports most of the major subscription platforms such as Recharge, Recurly, WooCommerce Subscriptions, OrderGroove, and many more!
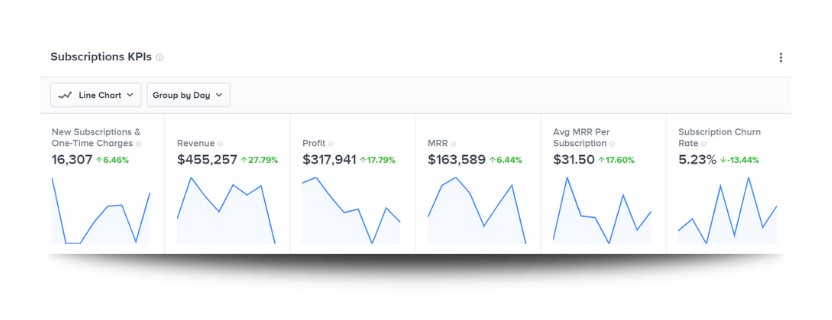
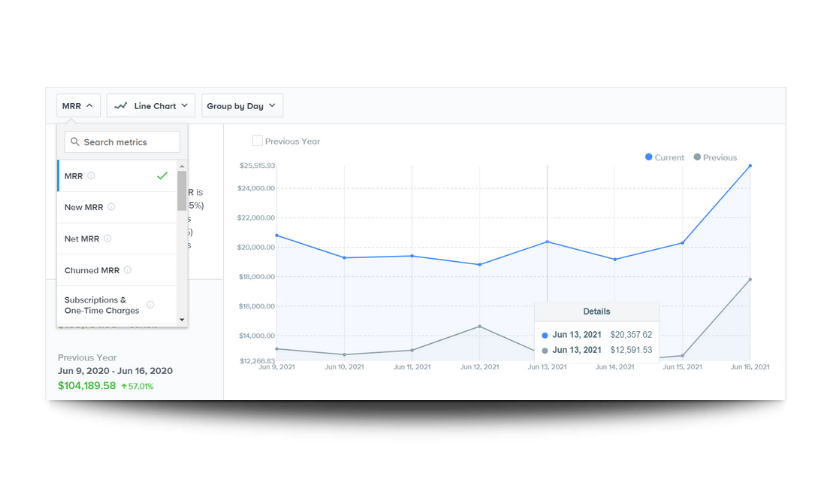
This Subscriptions section of our business intelligence software blends together costs from Shopify and revenue from subscription platforms to calculate subscription profitability.
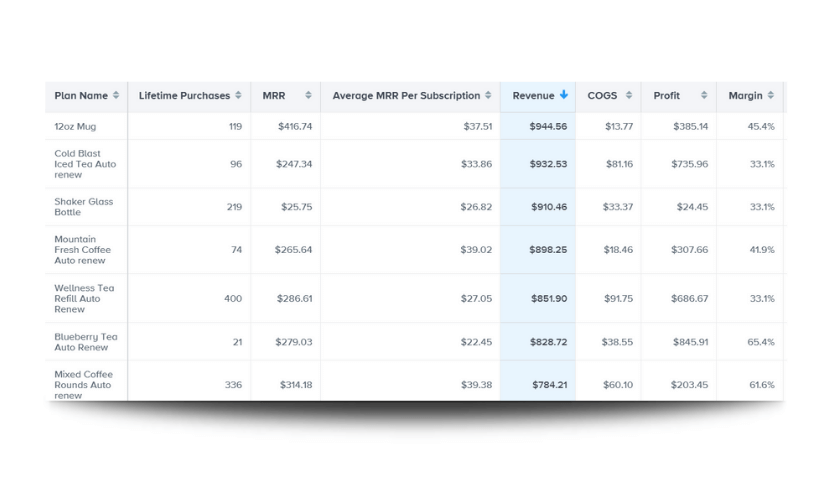
If your business offers multiple subscription plans, you can view these different plans broken down side by side to understand their:
- Gross profit,
- Profit margin,
- Sales, and
- Lifetime value metrics.
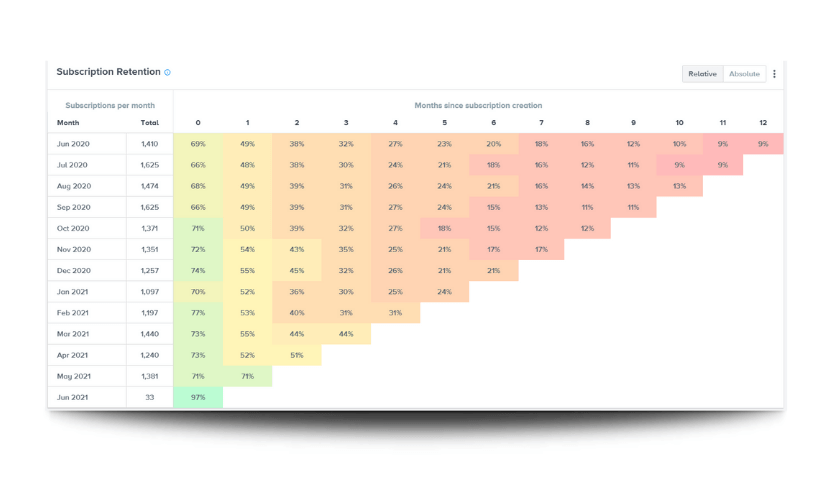
You can also compare how plans have impacted churn rate and retention; to see which plans have led to the most repeat business and where your business may actually be losing customers as well.
In addition, you can segment your subscription customers by any of these metrics. An example could be finding your highest lifetime value subscribers and creating an email marketing campaign just for them. For virtually any ecommerce business model, Insights has you covered.
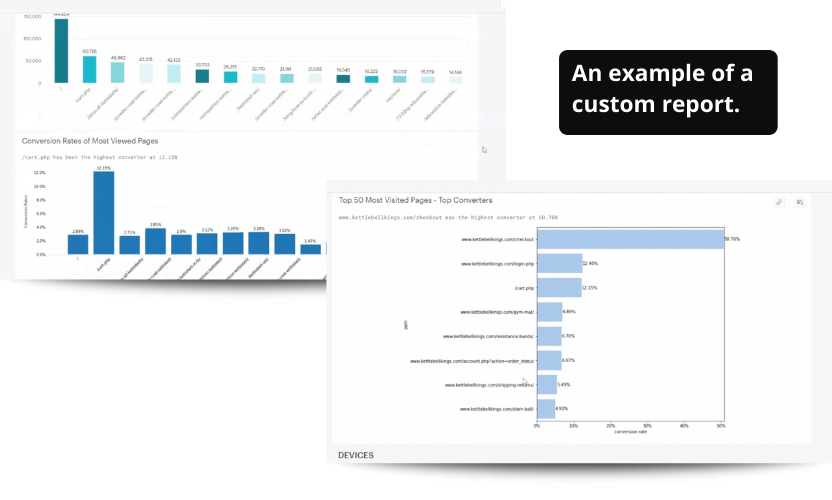
An Example of a Custom Report
Here’s an example of a report that will dig into the conversion rates of pages on a website.
What we’re interested in knowing as a conversion rate optimization agency is what is working on the website and what’s leading users to convert and what, perhaps, has been harming conversions.
One way to explore that is by looking at the conversion rates of the most popular pages on the website.
In this particular example, we see what their most viewed pages have been. You see the homepage, the cart page, some collection pages, product pages. Afterwards, we’re going to dive a bit deeper and take a look at what rates do visitors to each of these pages convert in comparison to other pages.
From this report, we can see that the cart page has converted at the highest rates. That’s not too surprising because it’s further down the funnel than some of these other pages.
But some popular pages have been converted much lower than others.
Market Basket Analysis 101: A Tutorial On Skyrocketing Revenue
It’s time to learn the secret of successful online shops – market basket analysis! Because, why sell one product when you can sell a perfect match?
So our agency will take a look into these high-traffic, but low converting areas and try to capture what has been harming conversions. We can take a look at where they’ve been converting high as well because perhaps there’s some useful information about these high converting pages we can use to boost the conversion rates of these low converted pages.
This report is built on a lot of code that digs deeper into the conversion rates of more pages than just the top 15. There are charts that go into the top 25, and those that look at your top 50 most visited pages!
Interestingly, in the top 50 view, we see that the page Shipping Returns has converted at the seventh-highest rates of all pages. That tells me that the shipping policy is a valuable piece of information to these customers. That could lead to a new experiment. Perhaps we could put more information about the shipping policy on product pages. That could be an interesting hypothesis to test, to see if that improves conversion rates.
You could also look into breaking down conversion rates of a page of interest by desktop, by mobile traffic, by some sources like Google versus Direct. It’s just one example where we can use your data to go even deeper and just maximize opportunities to improve conversion rates for your website.
Some Final Thoughts
Insights business intelligence software was made for experts that are serious about growing their business.
From the Highlights that include an overview of the most important metrics, to in-depth analysis of you marketing efforts performance, customer segments, products, orders and subscriptions, this BI tool will help you navigate data science like never before.
And in case that’s not enough – our team of data scientists will create custom reports (like market basket analysis) based on advanced data mining techniques.
But don’t take our word for it!
Try it yourself for 15 days free of charge (no credit card required)!