
a 4-minute read
Digging deep into your data reports will help you uncover optimization opportunities that will help you grow your business. Data segmentation is already a huge step forward compared to reading the averages. But what if we told you that by combining data from different reports you could:
- Come up with new insights,
- Set a hypothesis for new experiments,
- Identify opportunities for optimization in your eCommerce business.
Interested?
Great!
We will dig deep into a real-life example and show you exactly how to do it.
Step 1 | Analyzing Conversion Funnel Data
Let’s look at an example of a conversion funnel report.
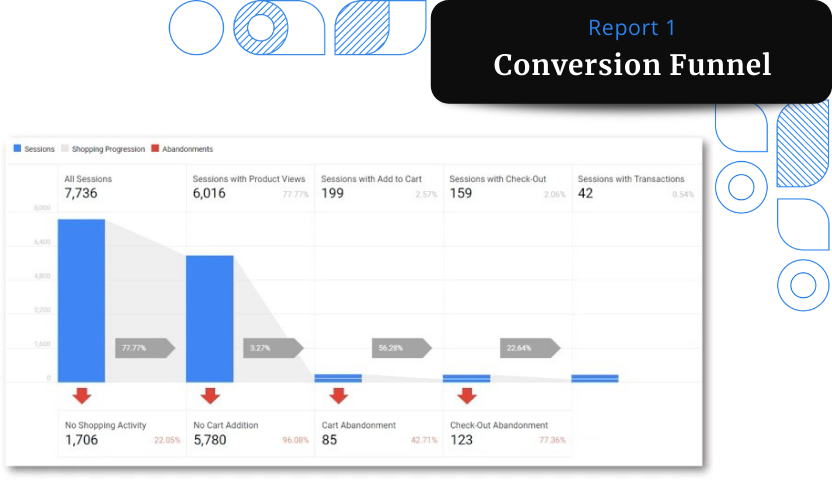
Essentially, it shows the flow of users from the moment they land on the website to when they view a product to when they go to add to cart checkout and then finally make a transaction.
This report gives us a great breakdown of the customer experience, and we can detect where is some friction happening. We can notice that 96% of users drop off from product page to add to cart.
This drop of users is potentially an optimization opportunity. But before rushing to do some experiments, try digging deeper into what is going on on the product page. How are your users behaving? Do some qualitative analysis or session recordings.
The truth is that this report only told us that there is something wrong with the product page and that optimizing it could lead to an increase in revenue. But we have so many clues left to uncover.
Step 2 | Segmenting Conversion Funnel Data by Device Type
The second step could be to segment the conversion funnel data by device type:
- Mobile,
- Desktop,
- Tablet.
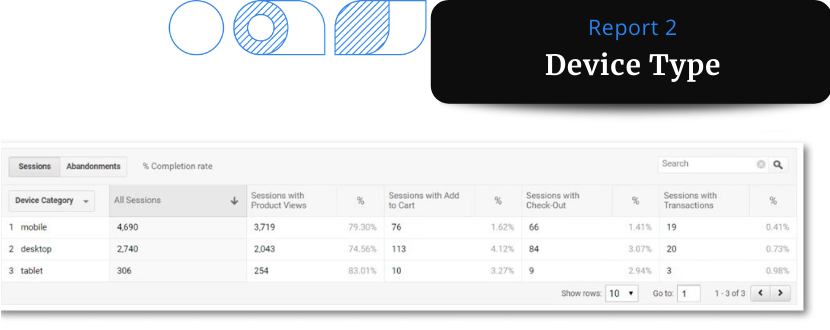
In this report, we can see that mobile gets the most number of sessions. This information is not surprising. Even though there is currently a noticeable and continuous drop in the mobile users since May 2020 and increase in desktop users (probably due to the change in habits provoked by Covid 19, that is an increase in work-from-home users) it is probable that once the crisis is over the number of mobile users will continue to increase.
But what is truly interesting is that in this report we see that the add to cart rate is significantly lower than that of desktop or tablet. This data tells us that maybe the mobile experience on the product page needs to be focused on. Comparatively the product page is performing way lower than the desktop version.
This comparative analysis gives us another layer of insights. It tells us that there’s a problem with the mobile experience. Now we can narrow our focus to user experience via a mobile device.
Step 3 | Segmenting Page Speed by Browser
A good starting point would be to breakdown and segment your data by looking at the browser that your visitors use on their mobile devices.
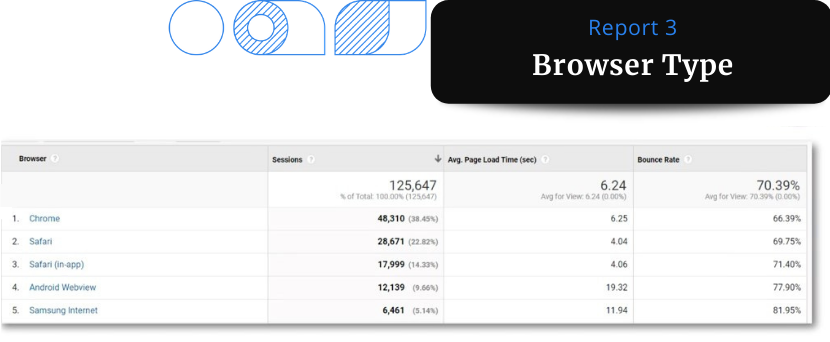
In this report we see:
- Chrome,
- Safari,
- Android Webview,
- Samsung Internet.
We instantly notice that Chrome is about 20% slower than Safari, so maybe that’s an opportunity to explore. As the page load time increases, it hurts the user experience. So, you should explore ways to improve the user experience on Chrome or Android.
We can also see that the product page takes 19 seconds to load on an Android and 11 seconds on Samsung. That means that 12,000 people have had a bad user experience. This is a great opportunity for optimization! If we improve the load time in the page speed for these users, maybe we’re going to have a lift in conversions! These users might have a better experience on the website, and that could lead to more transactions, conversions and navigations! All of this would greatly benefit the business.
Or would it?
Let us take it one more step further.
Step 4 | Segmenting Android Webview Users
If we break down the previously mentioned 12,000 Android Webview users, we’ll see that most of the browser versions are fine!
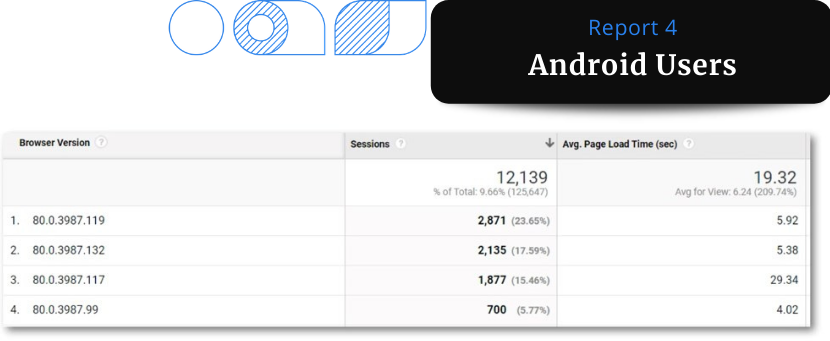
Only one type of browser is bringing up the average page speed and it is impacting 1,800 people. So, out of the original 12,000 users, now we’re facing only 1,800. This is why you should never rely on averages. They are very deceitful and can make you come to the wrong conclusions.
Now that you’ve seen this report, you can ask yourself:
- Who are these 1,800 users?
- Is it worth optimizing for them?
- What will be the cost?
- How would this benefit my business?
This kind of decision is a perfect example of a data-driven decision that can truly grow your business.
Some Final Thoughts
What is the point of doing all this segmentation and combining findings of all these reports?
The point is that you will save and earn a lot more money in the long run. Analyzing data and acting on it means that you probably do not have to invest additionally in your marketing efforts. You simply need to dig deep into your data and detect what segment is not performing well, because there is not much sense in investing more in advertising, promotion and directing more traffic to the website without first optimizing it.
By segmenting data and combining various data reports, you will discover optimization opportunities that will benefit your eCommerce business. This will put you in a position to make data-driven decisions like:
- Should we run some experiment?
- Will fixing functional things (like page speed) lead to an increase in conversions?
- Is this particular segment worth optimizing for?
We agree that instincts and gut feelings play a great role in growing business. But why base everything on a hunch when you can back up your decisions with irrefutable data?
If you have any trouble figuring out your data, give us a call. Our team of data scientists will be happy to help.