a 3-minute read
You might wonder what is the purpose of running experiments, not to mention spending so much of your time on analyzing and segmenting post-experiment data. You’re probably always in a hurry to reach those grand KPIs, and this would require additional resources. Yes, we know, we heard it so many times.
But, did you know that running tests can help you increase conversion rates more than 100%?
No?
Let us explain how:
Running tests and experiments will allow you to gather actionable and comparable data that will further allow you to make data-driven decisions that will grow your business at an exponential rate.
But, as always, there is a catch.
If you do not segment your data and compare various reports on each variation – you are not going to get far. Therefore, we decided to show you a real-life example of how two variations (plus the controlled one) performed and how we analyzed it.
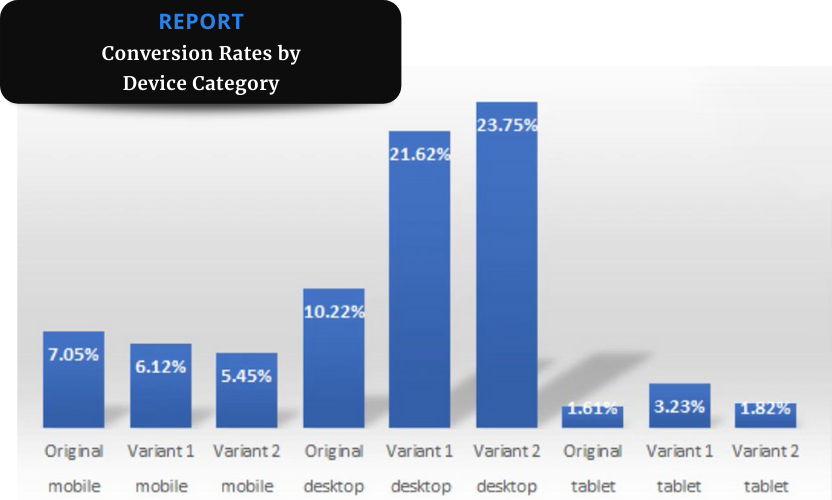
Post-Experiment Data Report Segmented by Device Type
In this chart, we can see only one segmentation.

We broke down the conversion rates by device type. And we can see right away that the conversion rates between mobile, desktop and tablet were different between variations:
- Mobile: the winner was the controlled variation.
- Desktop: the winner was variant number two.
- Tablet: the winner was variant number one.
What Does This Mean?
We are glad you asked.
These post-experiment data analysis show us that the experience we shared with users on the mobile device wasn’t optimal. There was something about the mobile experience in the controlled variation that was better for user experience and helped conversion rates.
However, our variation helped with the user experience on the desktop. That insight allows us to make the best of the second variation and explore how can we take it even further.
On the other hand, it tells us that there is something very wrong with variant number two on the mobile device. So, we should keep digging until we find out what did we do that hurt the conversion rates on the mobile device. Also, we should find out what did the controlled variation do better than us?
The findings will allow us to learn and optimize accordingly and explore new possibilities for running experiments.
Is Segmenting Post-Experiment Data Really That Important?
Not only is it important, our dear reader, but it is also necessary.
Data segmentation will save you from falling in the trap of averages. Click To TweetIf you read the averages of experiment variants, you would get a completely different picture! You could even think that variants didn’t significantly improve the conversion rates. And this couldn’t be farther from the truth!
Let’s see why:
Look at the desktop. The conversion rates were increased by more than 100%, and the same goes for tablets. And the reason why conversion rates weren’t significantly increased on mobile devices is that it attracted a lot of traffic, and that’s what brought the conversion rates down.
You see, the averages will never show you the full picture.
What Should I Do With This Information?
Here’s what we would do in this example. We would:
- Keep the variant number two for desktop,
- Variant number one for tablet, and
- We would apply different variations for different device types.
- Additionally, we could segment these variations by different categories, overlay, breakdown, and identify what user groups and user segments do and don’t resonate and come up with ideas to explore and push things further.
Some Final Thoughts
It is incredibly important that when you do a test, experiment, or try something new, don’t just observe the data and accept it without asking questions. You need to create a data extraction plan, dig into it and explore what does it mean for different segments of your audience. Trust us when we tell you that you can find all of the answers in post-experiment data. You just need to know where to look.
If you need some help finding answers, we’ve got your back.


