Case Study
How FurnacePrices Increased Lead Conversion Rates 322% After A Failed Experiment
February 17, 2021
This case study is about how the team at ConversionAdvocates managed to increase lead conversion rates of FurnacePrices by 322% by first DROPPING conversions by 50%.
Furnace Prices is one of the largest and most trusted sources of heating & air conditioning information for Canadians.
How does optimizing the website navigation bar impact visitor engagement and lead conversion rates?
Micro Conversion Increase engagement with the navigation bar and CTR from the different menu options to the information pages of the website.
Macro Conversion Increase Lead Conversion Rates of quote request forms on the website.
We noticed that people were spending a lot of time on the website (5+ minutes per session), visiting 4+ pages per session, and navigating through (what seemed to be) an illogical flow of pages on the website.
If the navigation bar was better structured for the users then visitors will find the information they are looking for and move further with their buying journey.
Google Optimize, Google Analytics, Lucky Orange
A/B Test
2
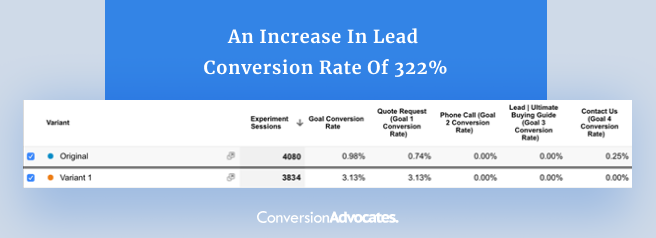
Over 322% INCREASE in lead form conversion rates (322% to be exact) from 0.74% to a whopping 3.13%
ConversionAdvocates
Using our proprietary IIEA framework we were able to uncover opportunities to increase lead conversion rates from 0.74% to 3.13%.
During our initial analysis, we noticed that people were spending a lot of time on the website (5+ minutes per session), visiting 4+ pages per session, and navigating through (what seemed to be) an illogical flow of pages on the website.
We used heat mapping and session recording software to understand how specific user segments were engaging with the website.
Based on this analysis, we created a FIRST hypothesis that “these visitors were LOST” and that they had no clear direction. From our observations, it felt like they didn’t know what they were looking for, and didn’t know where to go.
So we decided to simplify their experience and guide them through, what we believed was, a “better flow” by creating a simplified navigation bar that directed them to the most popular articles, resources, and pages on the website.
Conversion dropped almost 50% from 0.65% to 0.32% on both of our variations.
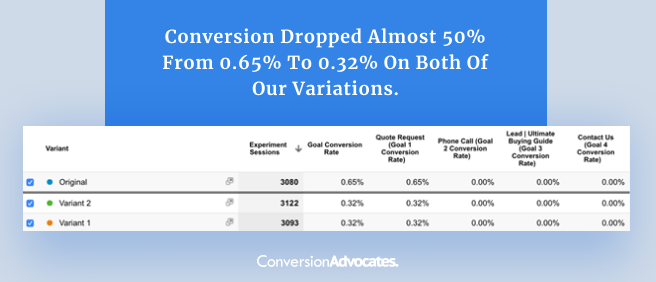
Because our analysis and test creation process is so tight, we use every failure as a LEVERAGE to our success. In this test, we were isolating for a very specific learning objective.
Hypothesis: “If the navigation bar is simplified then it will guide people to key pages and improve lead conversions.”
Now we have learned “WE WERE WRONG”
So we went in the opposite direction.
Based on the findings, we formulated our primary and secondary hypothesis for the experiment.
If the navigation bar is following a more complex structure then visitors will be more likely to complete the quote form.
If the navigation bar is presenting a lot more information options then visitors will be more likely to find what they are looking for.
For this experiment, we created an optimized variant of the furnaceprices.ca navigation bar in an attempt to increase lead conversion rates.
Some highlights of the experiment variation include:

After running the experiment for a few weeks, our hypothesis was proven TRUE with a 100% confidence level that experiment results will continue.
An increase in lead conversion rate of 322%.
Want to hear what the owners of Furnace Prices had to say about working with ConversionAdvocates teams?
Check out their telephone VERIFIED Review on Clutch.
Remove Obstacles To Conversion For Your Customers And Achieve Triple Digit Growth
Our Process Drives Consistent and Measurable Growth. We Build You An ROI Positive CRO Program In 90 Days

Book Your FREE Growth Strategy Call
Remove Obstacles To Conversion For Your Customers And Achieve Triple Digit Growth
Our Process Drives Consistent and Measurable Growth. We Build You An ROI Positive CRO Program In 90 Days